Hello to my fellow BI Enthusiasts. If you work on Spotfire, or if you are learning Spotfire, this Blog is for you. Here I discuss about the recent version of Tibco Spotfire – 10.3, or as they call it, Spotfire X.
Learn Tibco Spotfire Development. One of the best BI tools used Industry wide that is also a part of Gartner’s Magic Quadrant ! Click here for a complete course at the Cheapest price !
Table of Contents
Interface
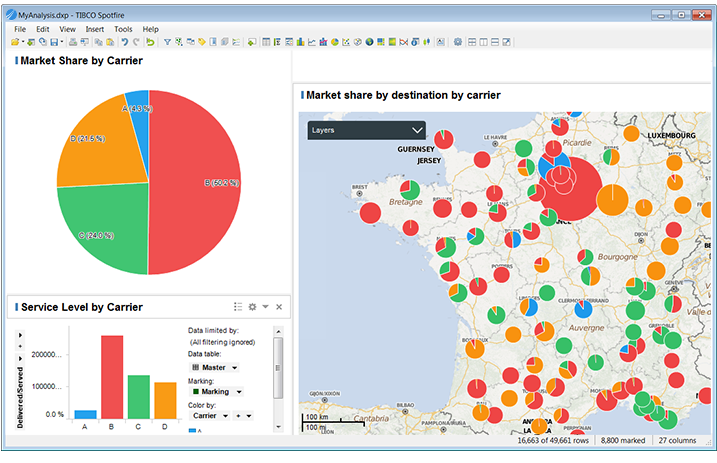
Here is how Spotfire looked until the previous versions –
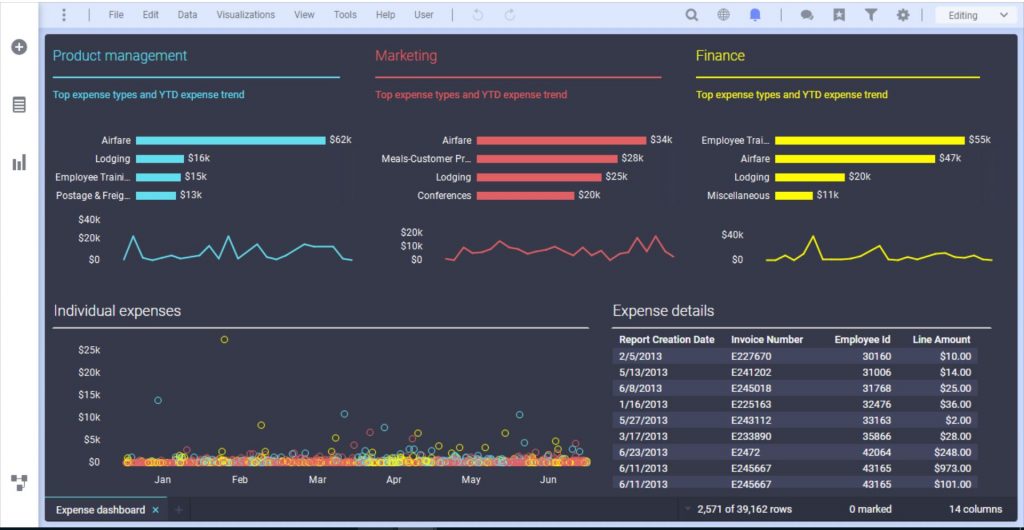
And here is how it looks now.
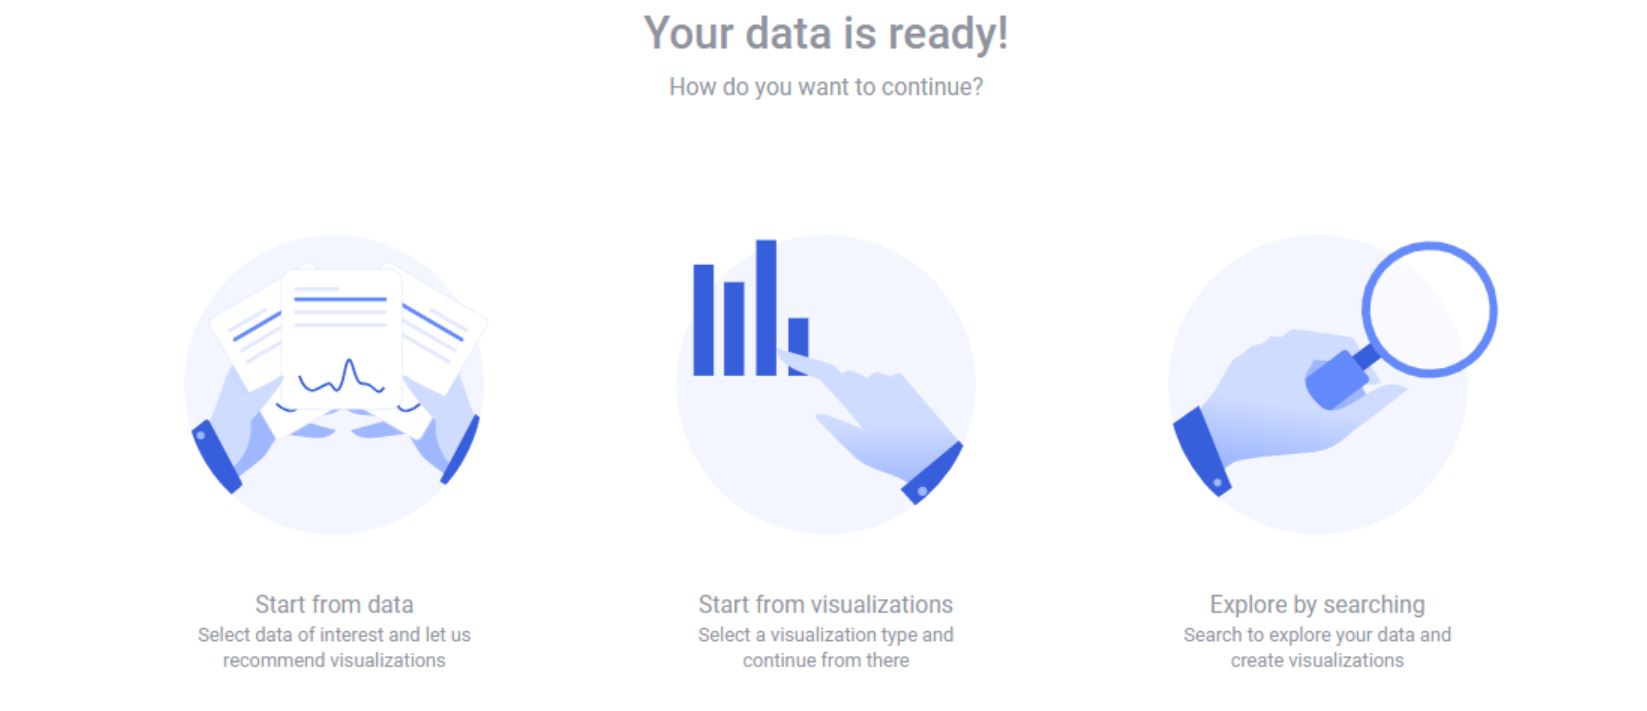
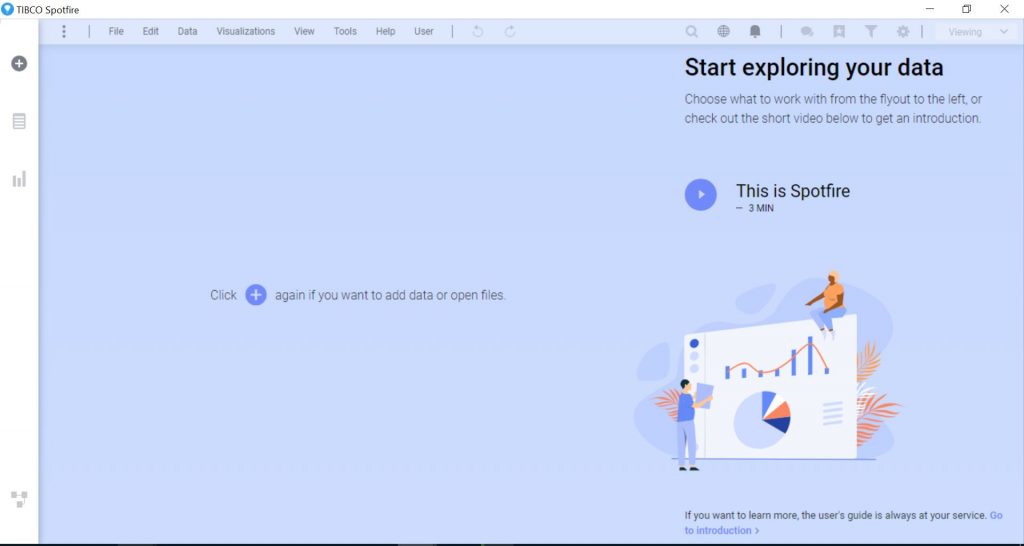
The start page earlier :
And the start page now –
Yes, a lot has changed in Spotfire X, mostly in the look and feel, the UI. However, at the core, the Spotfire is still robust, strong and multi-functional analytical tool used in many major organizations.
Here is the link to know more about Spotfire X : https://www.tibco.com/products/tibco-spotfire
Allright, lets dive into this new version now. I have made a complete video you can go through that tells about how things have changed in this new version and how you can leverage the new features to begin.
Planning to learn Web Development ? Here are the best courses in cheapest prices !
Adding Data in Spotfire X
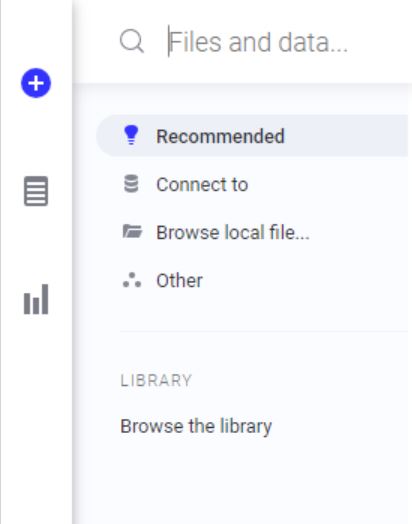
The way you load a new data set or add a new dataset to you
existing analytics is changed.
The + icon on the extreme left lets you add data – through an Information Link,
Data Connection, Excel, or simple copy paste
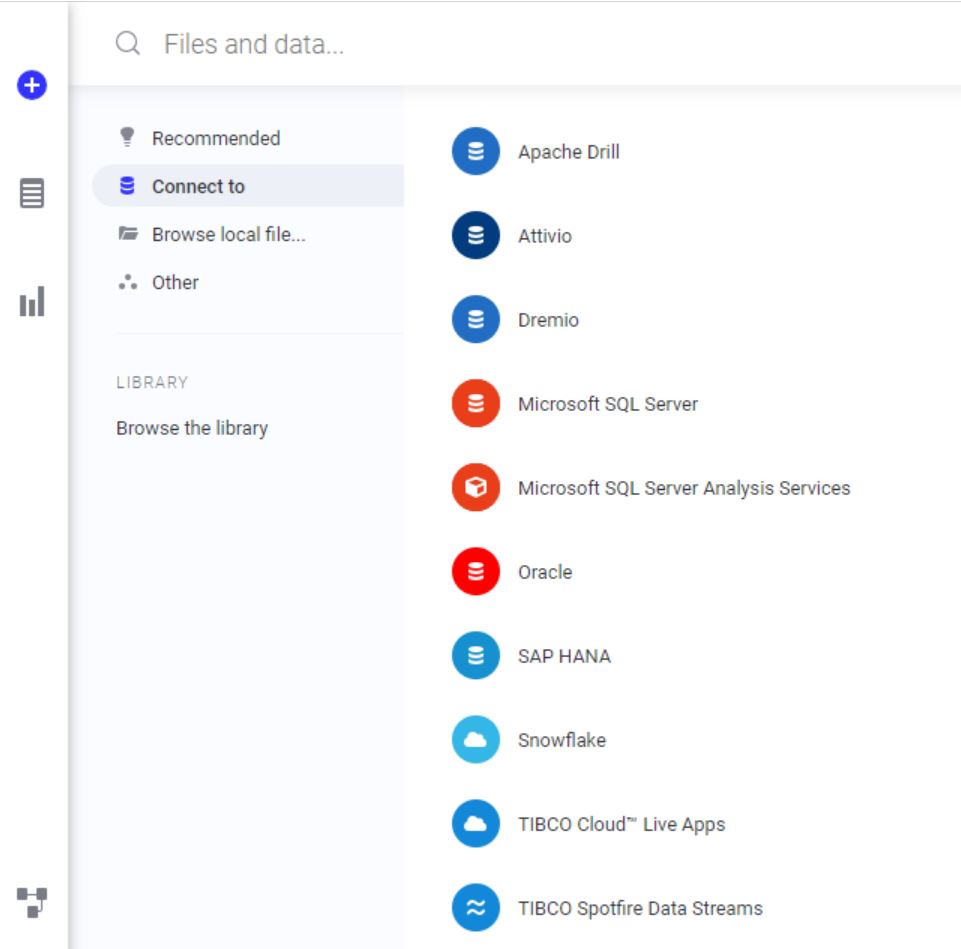
The data connection functionality is extended to multiple new database management tools, including SAP HANA, Apache Drill, and more.
Adding Visualizations in Spotfire X
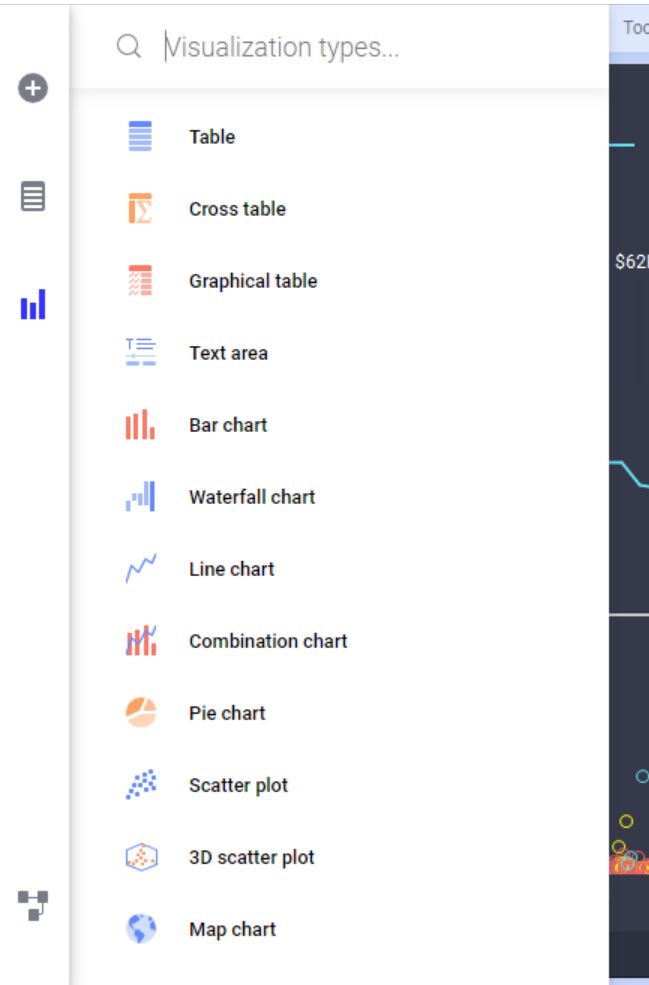
Earlier you would add different charts via the tool bar on the top, but now that is gone, and there is a ‘Bar Chart’ icon on the left below the ‘+’ sign, that has all the chart types in a list view – Line, Bar, Scatter, Pie, Graphical, Cross Table, Data Table – everything.
The way you edit the visualizations and work on them still remains the same.
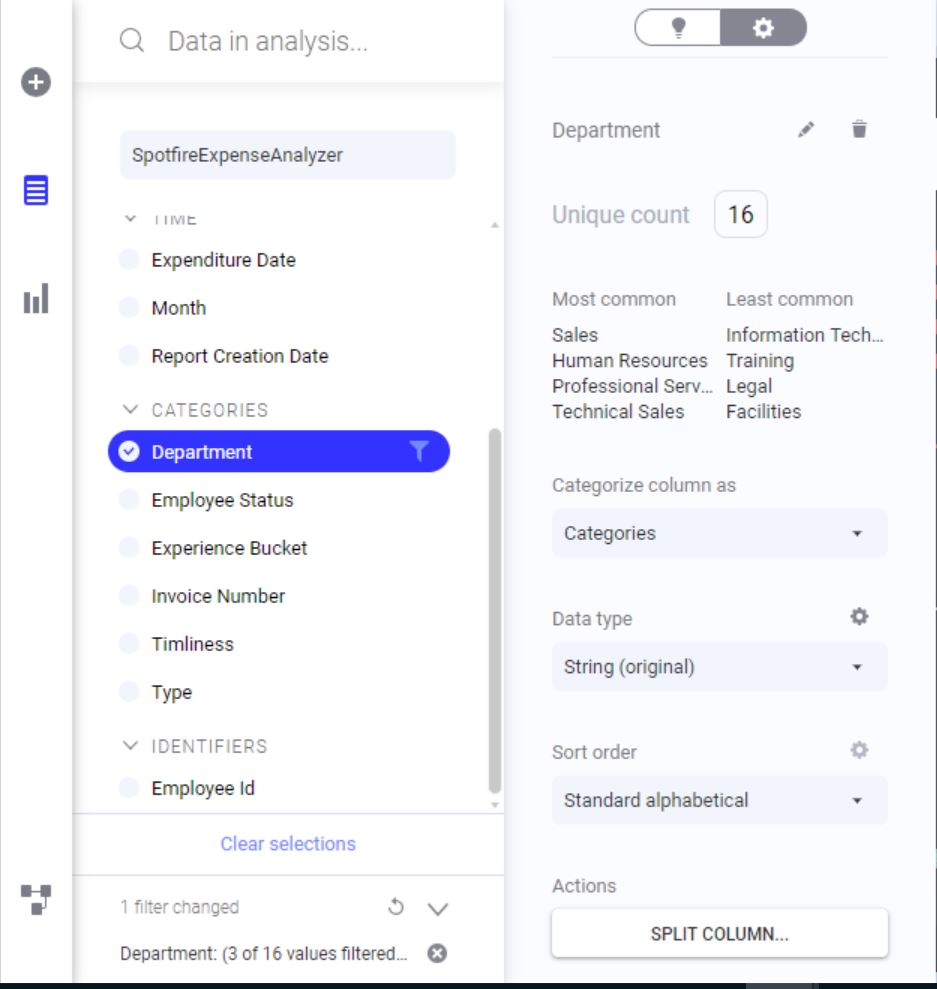
Editing Columns in a Data Set
To view the columns in a data set, you used to either go to Column properties, or hit the columns icon in the toolbar. But the new version has a CD stack kind of icon the left that will open up the same column panel like before, with a different look and feel.
Editing Data Set
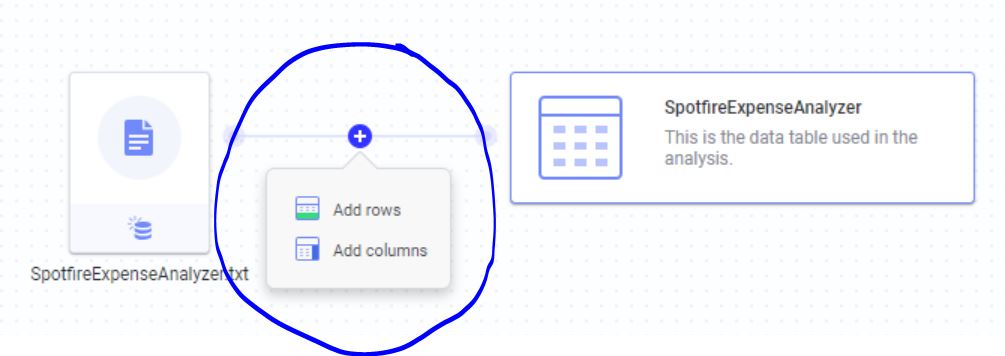
The whole new concept of ‘Data Canvas’ is introduced in this new version to let you do multiple things to your data at a single place. Rename, Delete and replace the data table from here. Add columns, rows from a new data table from here.
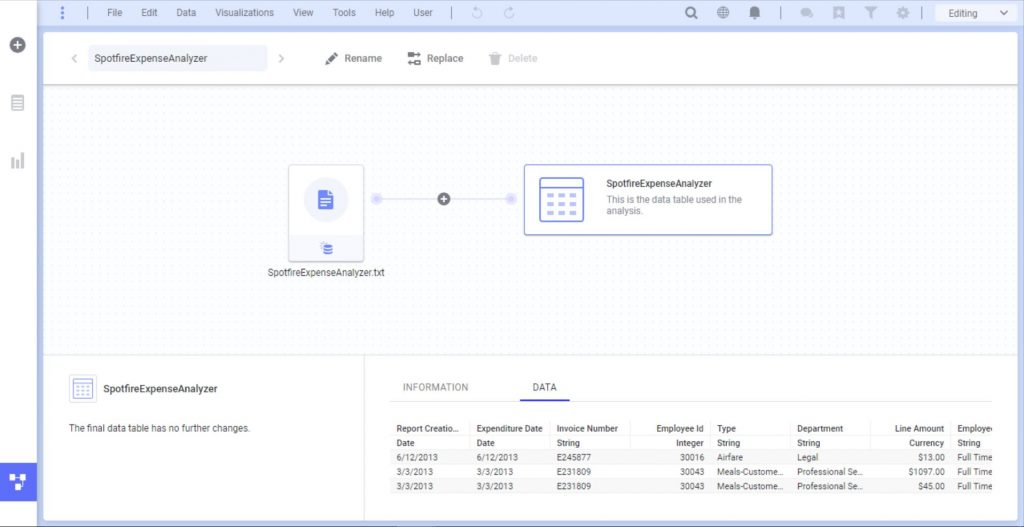
However, adding calculated columns and transformation can also be done from the menu bar under ‘Data’, and from data canvas both.
Learn Data Science – The highest paying job in the Industry !
The way you add columns/rows to a data table has changed. There is a more interactive way in Spotfire X to do that as the interface will give you examples on the joins in a graphical manner that’s really useful if you are not sure which join suits the best and how the new table would like post join.
Document Properties in Spotfire X
Document properties are to be accessed from the File menu. Here you can view/edit the Library properties, set markings, Filtering schemes and most importantly work on the Document Properties you create for your dynamic dropdowns, or python scripts. Scripts can be accessed from the File menu directly.
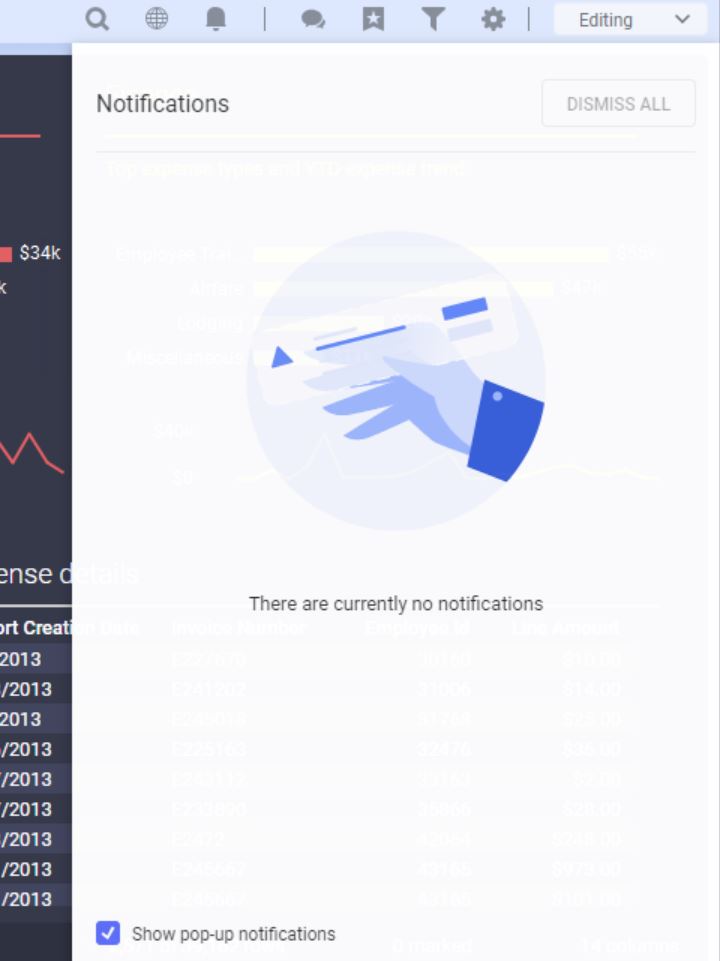
Tabs and Notifications in Spotfire X
Also, if you have noticed, the tabs are moved down. A big change. The notifications have gone right upside.
The Search feature in Spotfire X
The search feature is useful if you are new to Spotfire or
if you don’t know much of the development. It gives you power to simply search
using the column names and get recommended visualizations to simply select and
start exploring the data.
However, if you are a seasoned Spotfire developer, you know you’ll not be using
this feature a lot.

Predictive Analytics Capability
The predictive analytics capability is improved with this new version with features of Hierarchical clustering, regression and classification modeling and more advanced features.
Improved Help Features
Help and support has always been a highlight in Tibco products and this version also gives user a good support to perform analytics.
Editing / Viewing Feature
This features allows the analytical developer to lock the dashboard to not accidently make any changes. Again, regular developers would rarely use this feature.
More or less, the new version of Spotfire – 10.3 brings in exciting new features, an easy to use UI, and some additional analytical capabilities.
Interested in Business Intelligence ? Here is your Complete Guide !
Video Review of Spotfire X
Here is the complete video review of the same:
Official release notes from Tibco
The following new features have been added to version 10.3 of TIBCO Spotfire® Analyst.
Updated trust mechanism, including trust for data functions
The trust mechanism for JavaScript and IronPython scripts, and also for data connection custom queries, has been improved by introducing SHA-512 for calculating the trust stamp. In addition, the trust mechanism now also applies to data functions and TERR expression functions.
The updated trust functionality means that there are a few additional steps required during the upgrade to Spotfire 10.3, to make everything work as before. The exact steps to take will depend on your use case and environment – some examples are described in this article: https://community.tibco.com/wiki/script-and-data-function-trust-spotfire-103-and-later
Updated notifications
The notifications framework has been updated to allow pop-up notifications and sometimes include links to where you can fix issues.
The pop-up notifications can be switched off by clicking the Notifications icon on the menu bar and clearing the check box in the lower part of the flyout.
Reload data improvements
The stability of the data reloading functionality has been improved, in particular for complicated configurations. The API to reload data tables in an analysis has also been redesigned.
Edit and remove calculated columns from the data canvas
It is now possible to edit and remove top-level entities such as calculated columns, binned columns and group-from-marked columns directly from the data canvas.
You can also remove predicted columns, result columns from other types of calculations, custom hierarchies, tags and mask columns in the data canvas.
Custom display names for Spotfire servers
The Spotfire server now supports custom display names as an alternative to the URL to the server. This makes it easier for users to find the server they should connect to.
Specifying the display name can be done both on the Spotfire Server by setting a display name for a Site and also on a per-user basis in the Manage Servers page in the login dialog. A display name set in Manage Servers will override any display name defined on the Spotfire Server.
Improvements when browsing the library
● It is now possible to widen the content browser (the Files and data flyout) by dragging with the mouse, in order to see really long names.
● The tooltip when hovering over a Spotfire Analysis now includes the description, if any is available.
● It is now possible to sort the library contents according to the last modified date.
● Performance improvements – browsing the library is now faster.
Snowflake data connector
You can now access data from your Snowflake data warehouse, with the new data connector for Snowflake.
Native support for MemSQL, MariaDB, and MongoDB Connector for BI
You can now use the connector for Oracle MySQL to access data from MariaDB, MemSQL, and MongoDB Connector for BI.
TIBCO Cloud™ Live Apps data connector
You can now connect to and analyze your Live Apps case data in Spotfire, with the new data connector for TIBCO Cloud™ Live Apps.
Native support for PostgreSQL 11
You can now access data from PostgreSQL 11 with the data connector for PostgreSQL.
Geocoding coverage update
The following data has been updated:
● Over 4,000 new internal administrative boundaries (Admin 1, States, Provinces, Regions…) are now available worldwide.
● French region names are updated to the latest naming scheme.
Hide geocoding warnings
You can now hide geocoding table warnings that appear in the map chart title.
Layers control state
Whether the map chart layers control is expanded or collapsed, its state is now saved in the analysis.
Get the complete release notes with the product or from the website.
Start your own Website today ! A Complete Guide is here.
Conclusion
Spotfire X is a powerful upgrade to Spotfire versions. It has got amazing capabilities to fulfill all your Business Intelligence requirements. Hope this blog was useful to all Spotfire users. Comment and let me know your feedback on the new version. Happy Analytics !
I think the admin of this website is truly working hard for his site, for the
reason that here every stuff is quality based material.