The amount of data generated by the information society is growing day by day, and will continue to grow thanks to the explosion of social networks, the smarts cities, the big data, mobile devices, sensors, etc. This exponential increase in the volume of data that are generated makes it imperative the use of systems that are capable of analysing and turn them into useful information.
For this reason, our society, our businesses and institutions need intelligence at the moment to integrate within their organizational processes and decision, and this involves integrating tools of business analytics or smart data. This article provides an introduction to these tools of business intelligence, the associated main methodologies and current trends within this area.
The Business Intelligence industry is a rapidly evolving space which continues to show strong YoY growth with no obvious signs of slowing. As with any term as important as BI, there is a lot of confusion about what it is and how it may apply to your business. To help you understand this term, we’ve collected definitions and information regarding BI from around the web to share with you.
Table of Contents
What is Business intelligence (BI) ?
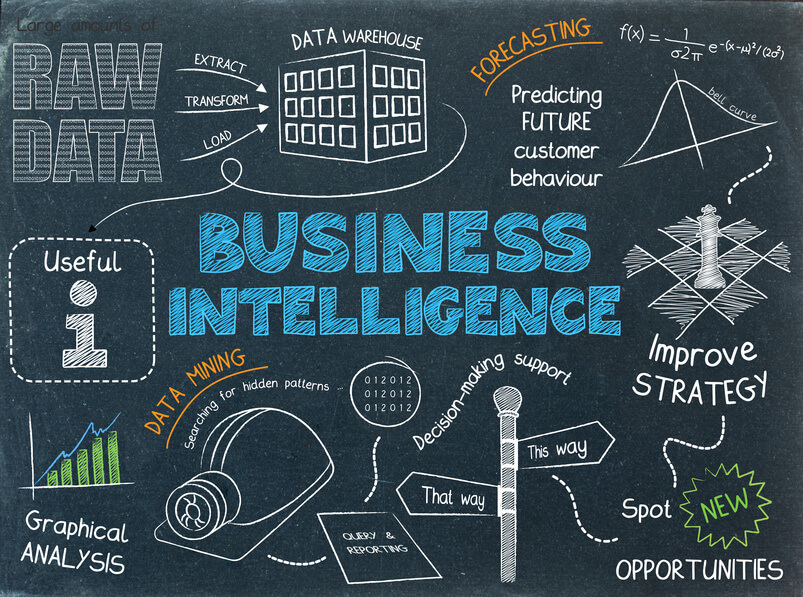
Let’s start with Google’s top result, Wikipedia: “Business intelligence (BI) is a set of theories, methodologies, processes, architectures, and technologies that transform raw data into meaningful and useful information for business purposes. BI can handle large amounts of information to help identify and develop new opportunities. Making use of new opportunities and implementing an effective strategy can provide a competitive market advantage and long-term stability.”

Business intelligence (BI) combines business analytics, data mining, data visualization, data tools and infrastructure, and best practices to help organizations to make more data-driven decisions. In practice, you know you’ve got modern business intelligence when you have a comprehensive view of your organization’s data and use that data to drive change, eliminate inefficiencies, and quickly adapt to market or supply changes.
BI is what leads to actionable insights. It takes the data from the different systems in your company and puts it in one neat location – your single source of truth. It can be used to improve efficiencies, find new opportunities, or predict future outcomes based on past performance.
Over the past few years, business intelligence has evolved to include more processes and activities to help improve performance. These processes include:
- Data mining: Using databases, statistics and machine learning to uncover trends in large datasets.
- Reporting: Sharing data analysis to stakeholders so they can draw conclusions and make decisions.
- Performance metrics and benchmarking: Comparing current performance data to historical data to track performance against goals, typically using customized dashboards.
- Descriptive analytics: Using preliminary data analysis to find out what happened.
- Querying: Asking the data specific questions, BI pulling the answers from the datasets.
- Statistical analysis: Taking the results from descriptive analytics and further exploring the data using statistics such as how this trend happened and why.
- Data visualization: Turning data analysis into visual representations such as charts, graphs, and histograms to more easily consume data.
- Visual analysis: Exploring data through visual storytelling to communicate insights on the fly and stay in the flow of analysis.
- Data preparation: Compiling multiple data sources, identifying the dimensions and measurements, preparing it for data analysis.
Learn Tibco Spotfire. One of the best BI tools used Industry wide that is also a part of Gartner’s Magic Quadrant ! Click here for a complete course at the Cheapest price !
What is pervasive BI?
It’s a term that is getting a lot of attention these days, but what is pervasive BI and why is it important?
The term “pervasive BI” refers to organizations that have included the majority of their employees in their business intelligence solution. This can take a variety of forms such as including middle management in the formation of realistic and useful objectives, or providing employees with access to performance dashboards. It is difficult to determine quantitatively if an organization’s BI solution is pervasive. Instead, qualitative measures should take precedent, looking at the solution’s influence and effectiveness at driving performance throughout the organization.
The goal of pervasive BI is not to simply provide access to raw data, but to include your employees in the formation and attainment of business objectives. The idea behind pervasive BI is to get everyone on the same page and working towards the same objectives.
What can BI do?
BI can help your business track performance against Key Performance Indicators (KPIs), get a better insight into what is really happening in the business, find new sales opportunities and improve customer service, optimize stock levels, analyze company financials and more. Some BI vendors specialize in in one specific area, while other vendors, provide value for departments across the business and presents data in graphs, dashboards and scorecards.
Stages of a Business Intelligence Project ?
Stage 1. Definition of objectives and requirements
The initial stage consists of performing an analysis of requirements, both present and future, of the organisation. From these requirements, a set of specific objects can then to be defined, focusing on their solution and satisfaction.
Stage 2. The choice of methodology and the tools to be used
Next, always keeping in mind the objectives and requirements, the specific methodology and the BI tools to be used should be chosen. This also entails the training and implementation of work teams.
Stage 3. Establishment of a work programme
In a detailed, precise and clear manner, all the actions to be carried out should be defined, as well as the necessary infrastructure and resources, to cover the chosen methodology for data analysis, together with the deadlines.
Stage 4. Presentation actions
The next stage consists of creating and presenting bulletins, reports, dashboard flowcharts and infographs, in a highly visual, clear and schematic format, aimed at facilitating the work of the professionals responsible for decision making.
Stage 5. Training, system and support programme implementation.
The execution of a BI process is only useful if the information, correctly analysed, reaches the people with decision-making capacity using the right support. Nevertheless, these people can only take the fullest advantage of the process if they have previously received adequate training and technical support, both with tools and with the correct data interpretation techniques.
Use Cases for Business Intelligence
- Analysing customer behaviours, buying patterns and sales trends
- Measuring, tracking and predicting sales and financial performance
- Budgeting and financial planning and forecasting
- Tracking the performance of marketing campaigns
- Optimising processes and operational performance
- Improving delivery and supply chain effectiveness
- Web and e-commerce data analytics
- Customer relationship management
- Risk analysis
- Strategic value driver analysis
Learn Google Data Studio via this fast paced course – covering all basic to advanced concepts !
Benefits of Business Intelligence
- Quick answers to critical business questions.
- Align activities with strategy.
- Reduce time spent on data entry and manipulation.
- Gain in depth real time insights into customers.
- Benchmark data against competitor and historical data for continuous improvements.
- Identify and analyze areas to cut costs and for budget allocation.
- Boost internal productivity by spending time on what’s important.
Industry wise usage of Business Intelligence
- Human Resources: HR can tremendously benefit from the implementation of Business Intelligence utilizing employee productivity analysis, compensation and payroll tracking, and insights into employee satisfaction.
- Finance: Business Intelligence can help finance departments by providing invaluable and in-depth insights into financial data. The application of BI can also help to track quarterly and annual budgets, identify potential problem areas before they cause any negative impacts, and improve the overall organizational business health and financial stability.
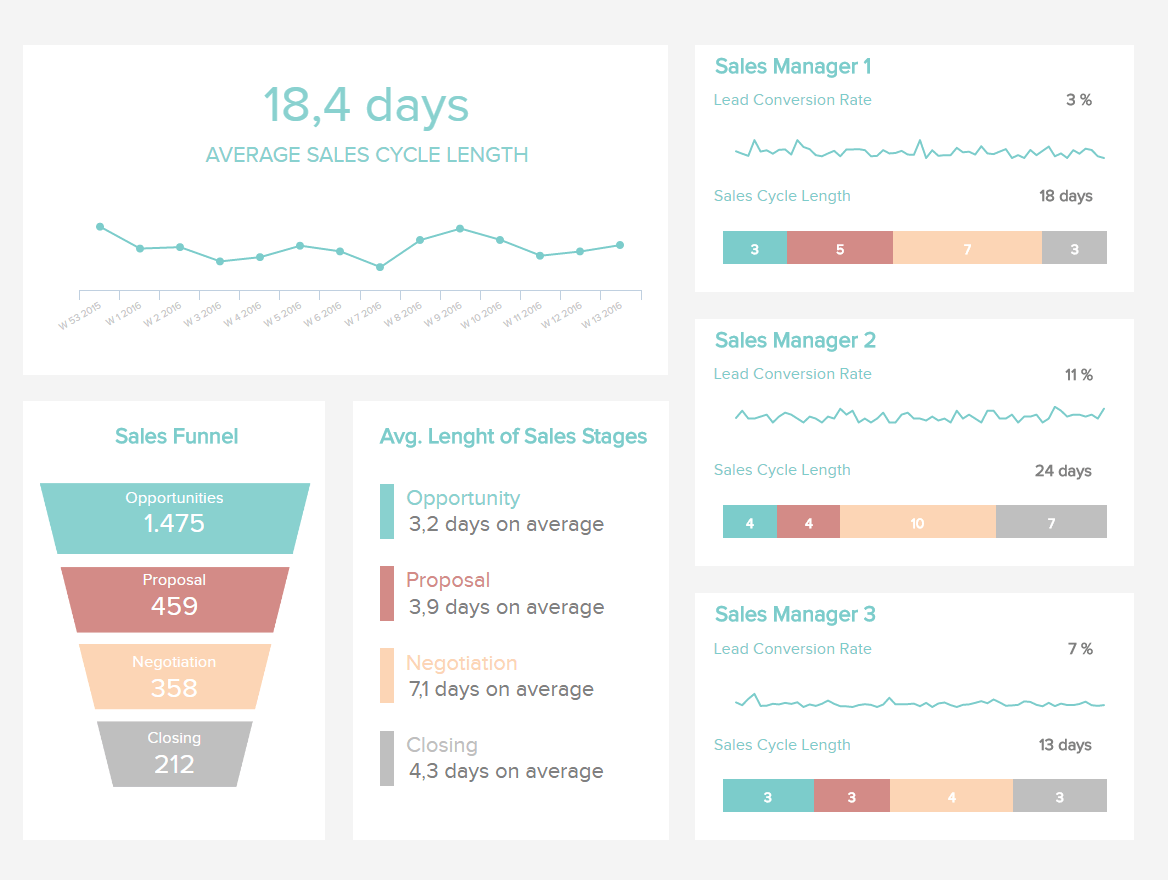
- Sales: Business Intelligence can assist your company’s sales force by providing visualizations of the sales cycle, in-depth conversion rates analytics, as well as total revenue analysis. BI can help your sales team to identify what’s working as well as points of failure which can result in dramatically improved sales performance.
- Marketing: BI provides the marketing department with a convenient way to view all current and past campaigns, the performance and trends of those campaigns, a breakdown of the cost per lead and the return on investment, site traffic analytics, as well as a multitude of other actionable pieces of information.
- Executive Leadership: Plain and simple, Business Intelligence allows organizations to reduce costs by improving efficiency and productivity, improving sales, and revealing opportunities for continuous improvement. Business Intelligence allows members of Executive Leadership to more easily measure the organization’s pulse by removing gray areas and eliminating the need to play the guessing game on how the company is doing.
Top Courses on Business Intelligence
Udemy
The Business Intelligence Analyst Course 2020
The skills you need to become a BI Analyst – Statistics, Database theory, SQL, Tableau – Everything is included

Master Course in Tableau 10 & 2019 for Business Intelligence
Master data visualization in tableau desktop. Covers tableau certification syllabus and more. Tableau Tutorials

Business Intelligence: Strategies, Tools & Techniques
Business Intelligence: Learn the basic principles & elements of business intelligence. Business Intelligence strategies

Complete Business Intelligence with SSIS, SSAS and SSRS
Master Microsoft BI by solving Real-Life Problems. Learn ETL, Integration, Analytics, Reporting and Visualization!

Microsoft Power BI – Business Intelligence for Beginners
Beginner Course on Power BI : Business Intelligence & Data/Business Analysis with Microsoft Power BI

edX
Business Intelligence for IoT Solutions
Discover and report the trends in your business data that lead to insights and improvements. This course will teach you how to use the latest data visualization tools to create reports using historical and live data.
Analyzing and Visualizing Data with Power BI
Learn Power BI, a powerful cloud-based service that helps data scientists visualize and share insights from their data.
MicroMasters® Program in Statistics and Data Science
Analyze big data and make data-driven predictions through probabilistic modeling and statistical inference; identify and deploy appropriate modeling and methodologies in order to extract meaningful information for decision making.

Data Visualization for All
Tell your story with charts and maps on the web, using easy-to-learn free tools: Google Sheets, Tableau, Highcharts, Carto, Leaflet, GitHub
Data, Analytics and Learning
An introduction to the logic and methods of analysis of data to improve teaching and learning.
Top Books on Business Intelligence
Business Analytics: The Science of Data – Driven Decision Making
The book has 17 chapters and addresses all components of analytics such as descriptive, predictive and prescriptive analytics.
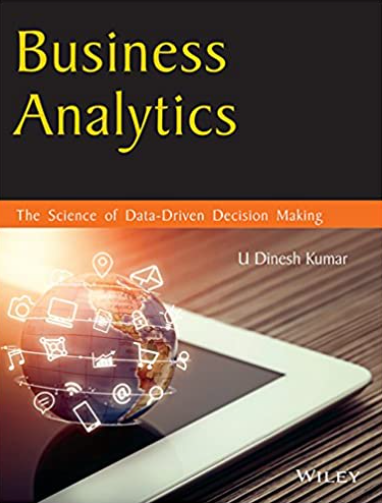
Topic included are- foundations of business analytics, Introduction to business analytics and its components such as descriptive, predictive and prescriptive analytics along with several applications, basic statistical concepts such as descriptive statistics, concept of random variables, discrete and continuous random variables, confidence interval, hypothesis testing, analysis of variance and correlation, predictive analytics techniques such as multiple linear regression, logistic regression, decision tree learning and forecasting techniques, Clustering, prescriptive analytics in which concepts such as linear programming, integer programming, and goal programming, Stochastic models and Six Sigma.
Business Intelligence: A Managerial Perspective on Analytics
Business Intelligence: A Managerial Perspective on Analytics, 3e, deals with a collection of computer technologies that support managerial work – essentially, decision making.
These technologies have had a profound impact on corporate strategy, performance and competitiveness. Collectively, these technologies are called business analytics and business intelligence.
Extensive, vivid examples from large corporations, small businesses and government and not-for-profit agencies have been incorporated which make the difficult concepts more accessible and relevant. International examples of global competition, partnerships and trade are also provided throughout. The real-world case studies show students the capabilities of business intelligence, its cost and justification and the innovative ways real corporations are using business intelligence in their operations.
Business Intelligence and Analytics: Systems for Decision Support
Business Intelligence and Analytics, 10e provides the only comprehensive, up-to-date guide to today’s revolutionary management support system technologies and showcases how they can be used for better decision-making.
The 10th edition focuses on Business Intelligence (BI) and analytics for enterprise decision support in a more streamlined book. In addition to traditional decision support applications, this edition expands the reader’s understanding of the various types of analytics by providing examples, products, services and exercises by discussing Web-related issues throughout the text.
Latest Trends in Business Intelligence
In-memory database
In-memory database processing utilizes RAM instead of disk or hard drive processing in order to read information. Accessing information in this manner increases the application performance exponentially.
Using BI across Business departments
More and more, BI users aren’t IT staff; they’re employees with a standard amount of technological savvy that want to harness the power of BI to get a competitive advantage.
Consequently, the design of reporting mechanisms and ease of use of analytics functions are being driven toward a lower barrier of access. No longer is it enough to have excellent analysis or data warehousing features; they must be usable by both IT experts and business users with no analytical experience.
Embedded analytics
Business intelligence software promises to clarify business analytics for the most non-technical of employees, which has driven the demand for embedded analytics tools. These tools let companies build data visualizations within their BI software, and dynamically serve those visualizations to internal and external customers within company apps.
Data Discovery
Data discovery is a user-directed process by which unknown or unusual patterns and values can be discovered in data. Data discovery consists of collecting data from its various databases and silos and consolidating them into a single source that can be evaluated easily and in real time. It allows you to discover, in a few clicks, the factors that contribute to a trend as soon as it has been discovered.
Self-service Analytics
Self-Service analytics allows end users to easily analyze their data by creating their own reports and modifying existing ones without the need for training. Self-service analytics or ad hoc reports offer users the ability to create reports quickly, allowing them to get data analysis in minimum time. End users can analyze their data by dynamically modifying or adding calculation functions to a report. This flexibility lessens the burden on the technical department, freeing up development resources.
Augmented Analytics
Augmented analytics offers automation of data analysis through machine learning and natural language processing. This advanced use, manipulation and presentation of data simplifies data to present clear results and provides access to sophisticated tools for business users to make day-to-day decisions with confidence. Users can go beyond opinion and prejudice to get a true picture and act on data quickly and accurately.
Business Intelligence Job Responsibilities
Business intelligence analysts use data to figure out market and business trends for companies to increase profits and efficiency. They may work directly for a company or as a consultant. … They able to look at large chunks of data and understand trends, and then communicate those trends to the company.
BI or Data Analyst is a fast-growing role, almost every company with data will need at least one person who understands BI. As working in BI, you either can focus on the business side such as organise information with different parties and interpret them to the management team.
If you enjoy doing technical tasks, there is a big room for you to just focus on development sides such as Power BI, data warehouse and data-related tasks. That is why BI has been a very popular choice for people who want to change career to IT/Software. People with marketing, finance, accounting, business management can all do BI and they usually do better than those who just recently graduated. The main reason is BI does require a good understanding of the business operation and people communication.
Here are some basic skills required,
- SQL and relational database, Data Warehouse
- SSRS/SSAS/SSIS, ETL (Extract, Transform, Load), Report Builder
- Power BI, DAX, and security rules.
- Some coding skills like VB, C#, JavaScript etc.
Business Intelligence Job Tiltes
BI jobs can be titled in multiple other ways as listed here.
- Business Intelligence Analyst
- Market Intelligence Analyst
- Business Data Analyst
- IT Business System Analyst
- Data Engineer
- Data Warehouse Analyst
- User Experience Analyst
- Business Intelligence Product Manager
- Business Analytics Specialist
- Business Intelligence Developer
What is a Business Intelligence software?
Business intelligence software is a set of tools used by companies to retrieve, analyze, and transform data into useful business insights. Examples of business intelligence tools include data visualization, data warehousing, dashboards, and reporting. In contrast to competitive intelligence, business intelligence software pulls from internal data that the business produces, rather than from outside sources.
Top BI Tools in Industry right now
TIBCO Spotfire
TIBCO Spotfire® is a data visualization platform that utilizes predictive analytics. In addition to data viz, it includes data wrangling capabilities, predictive analytics, location analytics, and real-time streaming analytics.
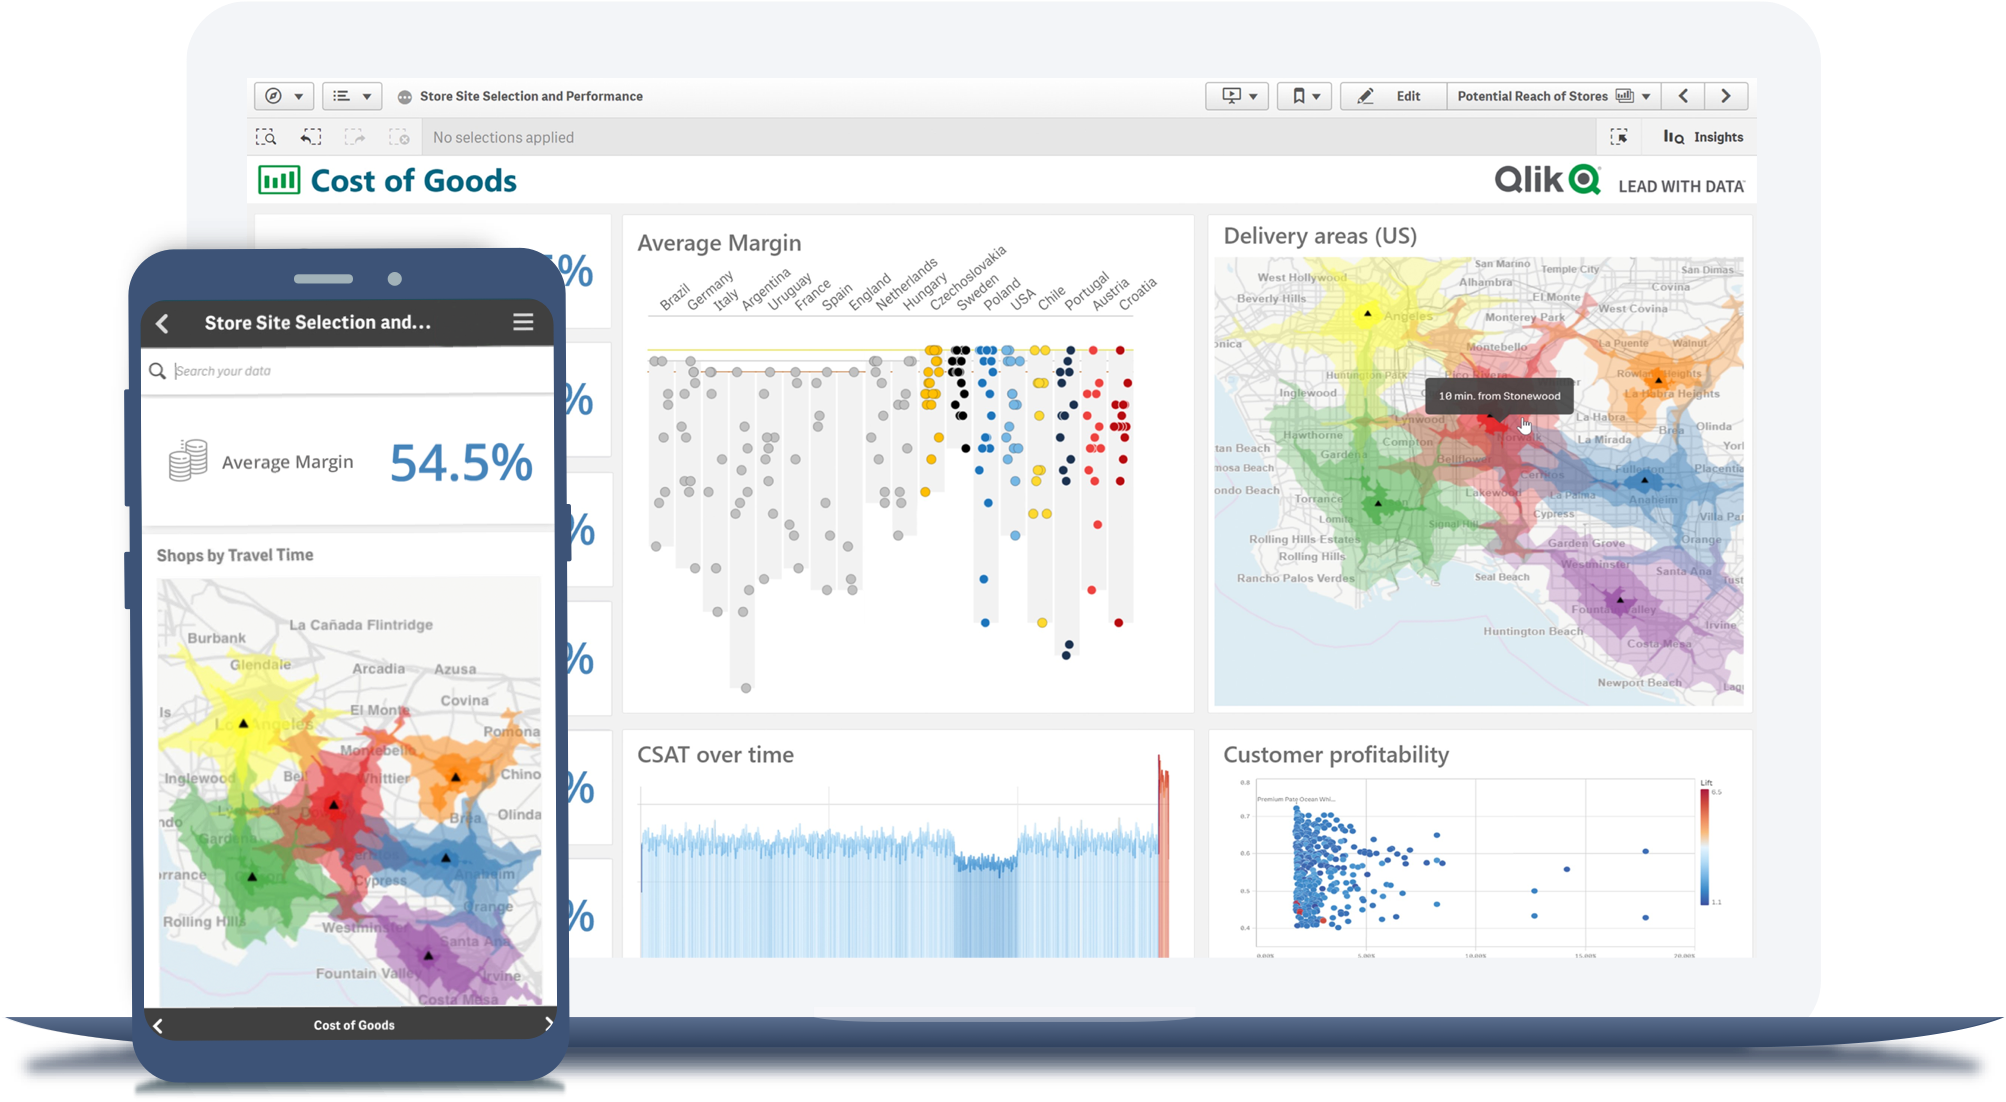
Qlik Sense
Qlik Sense® is a self-service BI platform for data discovery and visualization. It supports a full range of analytics use cases—data governance, pixel-perfect reporting, and collaboration. Its Associative Engine indexes and connects relationships between data points for creating actionable insights.
SAP Crystal
SAP Crystal is an analytics and reporting software solution for SMBs. SAP Crystal comprises Crystal Reports for pixel-perfect reporting, and SAP Crystal Server for automated distribution and self-service access to reports, dashboards and data exploration.
Tableau Desktop
Tableau Desktop is a data visualization product from Tableau. It connects to a variety of data sources for combining disparate data sources without coding. It provides tools for discovering patterns and insights, data calculations, forecasts, and statistical summaries and visual storytelling.
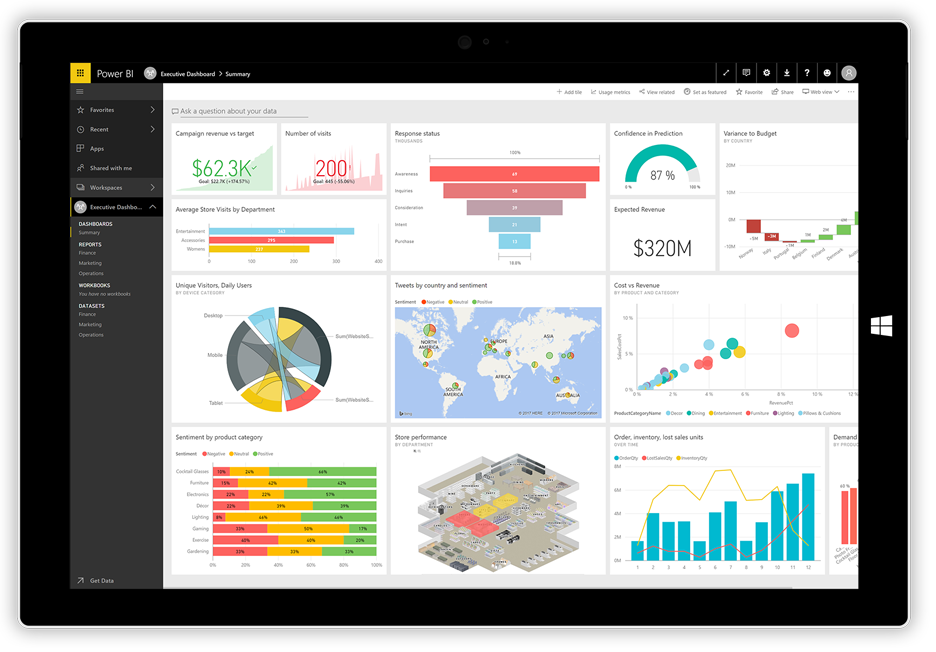
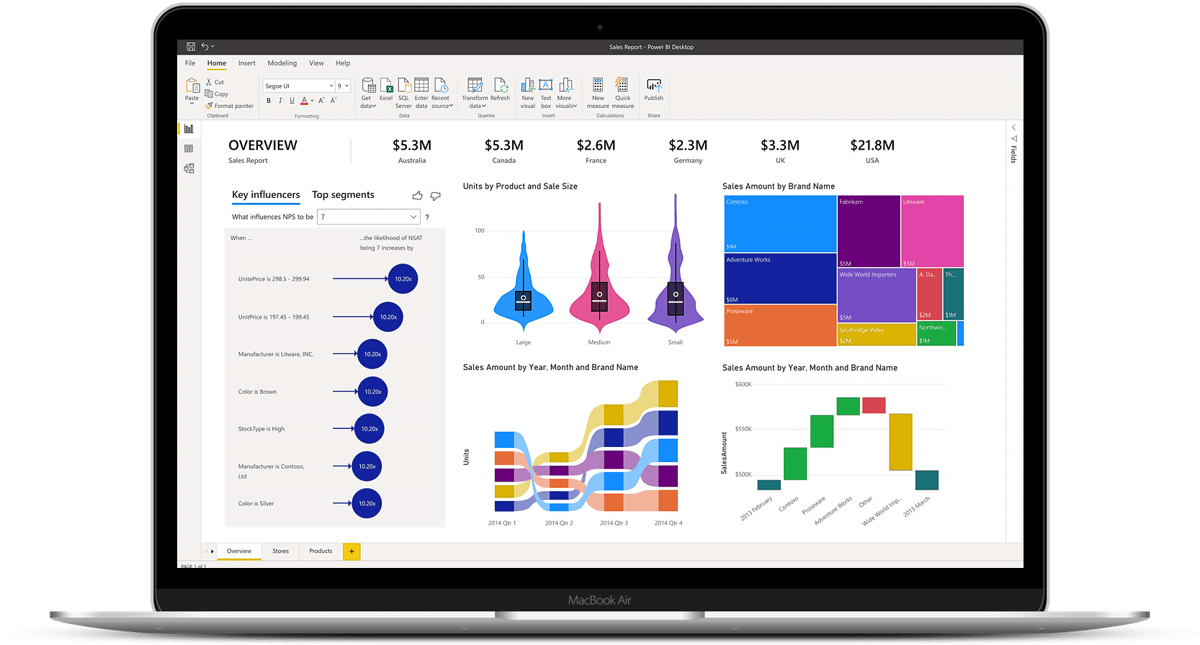
Microsoft Power BI
Microsoft Power BI is a visualization and data discovery tool from Microsoft. It allows users to convert data into visuals and graphics, visually explore and analyze data, collaborate on interactive dashboards and reports, and scale across their organization with built-in governance and security.
Sisense
Sisense is a BI software and analytics platform. With what the vendor calls their In-Chip™ and Single Stack™ technologies, users have access to a comprehensive tool to analyze and visualize large, disparate data sets without IT resources.
IBM Cognos
IBM Cognos is a full-featured business intelligence suite by IBM, designed for larger deployments. It comprises Query Studio, Reporting Studio, Analysis Studio and Event Studio, and Cognos Administration along with tools for Microsoft Office integration, full-text search, and dashboards.
Looker
Looker is a BI application with an analytics-oriented application server that sits on top of relational data stores. It includes an end-user interface for exploring data, a reusable development paradigm for data discovery, and an API for supporting data in other systems.
MicroStrategy Analytics
MicroStrategy Analytics is an enterprise business analytics and mobility platform. Key features include automatic big data analysis and reporting, data discovery and visualization, digital security credentials, and support for mobile devices.
Alteryx Platform
Alteryx Platform is a business intelligence and predictive analytics solution. The vendor’s value proposition is that their solution provides analysts with the unique ability to easily prep, blend, and analyze all of their data using a repeatable workflow, then deploy and share analytics
The A to Z Glossary of Business Intelligence
Phocas in their Blog have collated an A to Z of BI glossary that will be your number one go-to guide for BI terminology. They have scrolled the internet to find the very best BI definitions from the Oxford Dictionary, Tech Republic, Gartner and BusinessDictionary.com.
Here you go –
A
Ad hoc query: the ability to create a one-off, “on demand” report from BI or analytics software that answers a specific business question.
Ad hoc analytics: is a business intelligence process designed to answer a single or specific business question. The product of ad hoc analysis is typically a statistical model, analytic report, or other type of data summary.
Aggregate data: formed or calculated by the combination of many separate units or items.
Analysis: detailed examination of the elements or structure of something, typically as a basis for discussion or interpretation.
Analytics: the systematic computational analysis of data or statistics. Phocas data analytics lets you dig into a consolidated view of your actual product, customer and financial data.
Application Programming Interface (API): is code that allows two software programs to communicate with each other.
B
Balanced scorecard: a performance management tool that holistically captures an organization’s performance from several vantage points (e.g. sales results vs. inventory levels) on a single page.
Behavioural analytics: using data about people’s behaviour to understand intent and predict future actions.
Big data: extremely large data sets that may be analysed computationally to reveal patterns, trends, and associations, especially relating to human behaviour and interactions.
Business intelligence (BI): is a technology-driven process for analysing data and presenting actionable information to help corporate executives, business managers and other end users make more information business decisions.
C
CRM: denoting strategies and software that enable a company to organize and optimize its customer relations.
Contextual data: a structuring of big data that attaches situational contexts to single elements of big data to enrich them with business meaning.
Criteria: a principle or standard by which something may be judged or decided.
D
Data: facts and statistics collected together for reference or analysis.
Database: a structured set of data held in a computer, especially one that is accessible in various ways.
Dashboards: a graphical summary of various pieces of important information, typically used to give an overview of a business. Dashboards allows you to see at a glance how your business is performing with an option to dive into the underlying data in the lightning fast grid – sitting behind the dashboard.
A dashboard is a page within a BI solution that lets users easily see metrics relevant to them. For example, you might want to track monthly revenue against a particular goal, see how many sales each sales rep is bringing in, keep track of stock levels, or see which customers you are losing. Importantly, good BI solutions will have the option to restrict users to only see data relevant to their job role.
Data model: a data model is the result of collaborative effort between end business users and IT database analysts.
Data point: an identifiable element in a data set.
Data cleansing: is the process of amending or removing data in a database that is incorrect, incomplete, improperly formatted, or duplicated.
Data Source Name (DSN): is a data structure than contains the information about a specific database that an Open Database Connectivity (ODBC) driver needs in order to connect to it.
Drill-down: access data that is in a lower level of a hierarchically structured database. ‘Drill down is a term that refers to the dynamic nature of BI reports and dashboards. In contrast to traditional reporting from enterprise resource planning (ERP) or customer relationship management (CRM) systems which are static and only give you a glimpse of a period of time. BI lets you ask questions of your data and then keep drilling down as the need for more answers arise.
E
ERP: the management of all the information and resources involved in a company’s operations by means of integrated computer system.
Export: transfer (data) in a format that can be used by other programs.
ETL (Extract, Transform, Load): is three separate functions combined into a single programming tool. First, the extract function reads data from a specified source database and extracts a desired subset of data. Next, the transform function works with the acquired data – using rules or lookup tables, or creating combinations with other data – to convert it to the desired state. Finally, the load function is used to write the resulting data (either all of the subset or just the changes) to a target database, which may or may not previously exist.
F
Filter: software that processes text, for example to remove unwanted spaces or to format it for use in another application.
Forecasting: a prediction or estimate of future events.
G
Geospatial analysis: the gathering, display, and manipulations of imagery, GPS, satellite photography and historical data, described explicitly in terms of geographic coordinates or implicitly, in terms of a street address, postal code, or forest stand identifier as they are applied to geographic models.
Gap analysis: a study of whether the data that a company has can meet the business expectations that the company has set for its reporting and BI, and where possible data gaps or missing data might exist.
Gauges: a device for measuring the magnitude, amount, or contents of something, typically with a visual display of such information.
H
Hierarchy: an arrangement or classification of things according to relative importance or inclusiveness.
I
Interactive visualization: technology enables the exploration of data via the manipulation of chart images, with the color, brightness, size, shape and motion of visual objects representing aspects of the dataset being analysed. These products provide an array of visualization options that go beyond those of pie, bar and line charts, including heat and tree maps, geographic maps, scatter plats and other special-purpose visuals.
J
Joint Application Development (JAD): is a methodology that involved the client or end user in the design and development of an application, through a succession of collaborative workshops called JAD sessions.
K
Key Performance Indicator (KPI): a quantifiable measure used to evaluate the success of an organization, employee, etc., in meeting objectives for performance.
L
Lead generation: the use of a computer program, a database, the Internet, or a specialized service to obtain or receive information for the purpose of expanding the scope of business, increasing sales revenues, looking for a job or for new clients or conducting specialized research.
M
Metadata: a set of data that describes and gives information about other data.
Metrics: a method of measuring something, or the results obtains from this: ‘the report provides various metrics at the class and method level.’
Mobile BI: is software that extends desktop business intelligence applications so they can be used on a mobile device. Phocas is a fully mobile software solution that allows access to your data, dashboards and reports wherever you are on smartphones and tablets.
Management Information System (MIS): a computerized information-processing system designed to support the activities of company or organizational management.
N
Non-value-adding: refers to activities within a company or supply chain that do not directly contribute to satisfying end consumers’ requirements. It is useful to think of these as activities that consumers would not be happy to pay for.
O
Online Analytical Processing (OLAP): is computer processing that enables a user to easily and selectively extract and view data from different points of view.
Online Transaction Processing (OLTP): is a class of software programs capable of supporting transaction-oriented applications on the internet.
Open Database Connectivity (ODBC): is an open standard application programming interface (API) for accessing a database.
Optimization: the actions of making the best or most effective use of a situation or resource.
P
Personalization: design or produce (something) to meet someone’s individual requirements.
Platform: a standard for the hardware of a computer system, which determines which kinds of software it can run. For example, Phocas can be delivered via cloud software-as-a-service (SaaS), private cloud or on premise.
Portal: an internet site providing access or links to other sites.

Q
Query: a database query is a questions, often required to be expressed in a formal way.
R
Ranking: the actions or process of giving a specified rank or place within a grading system.
Role-based access control (RBAC): is a method of regulating access to computer or network resources based on the roles of individual users within an enterprise.
S
Slice and dice: divide a quantity of information up into smaller parts, especially in order to analyse it more closely or in different ways.
Slicing and dicing refers to the way you can easily segment this data. For example, you might see you are not on track to make a monthly sales target. You can click this metrics to drill down to the underlying data. Here you might slice and dice to see whether it is a particular region, sales rep or product group that is driving the poor performance.
Snapshot: a brief look or summary. A record of the contents of a storage locations or data file at a given time.
Software as a Service (SaaS): is a software distribution model in which applications are hosted by a vendor or service provider and made available to customers over a network, typically the Internet.
Structured Query Language (SQL): an international standard for database manipulation.
Supply Chain Management (SCM): is the oversight of materials, information, and finances as they move in a process from supplier to manufacturer to wholesaler to retailer to consumer.
T
Technology-enabled relationship management (TERM): the concept of forming one enterprise-wide view of the customer across all customer contact channels (i.e., sales, marketing, and customer service and support). It is a complex area, requiring complex solutions to problems of integration, data flow, data access and marketing strategy. A critical component is the database that serves as the customer information repository.
U
Uniform Resource Locator (URL): is the character string that identifies an Internet document’s exact name and location.
V
Visualization: the representation of an object, situation, or set of information as a chart or other image. Phocas visualizations presents your findings as a striking chart while always having the option to drill down into the data behind the image.
W
Data Warehouse: a large store of data accumulated from a wide range of sources within a company and used to guide management decisions.
Z
Zero Latency Enterprise (ZLE): firm that can respond to internal and external events as they occur because information is exchanged across departmental or divisional boundaries without any delay.
Common Questions around Business Intelligence
What is business intelligence in simple terms?
In simple Terms, The term Business Intelligence (BI) refers to technologies, applications and practices for the collection, integration, analysis, and presentation of business information. The purpose of Business Intelligence is to support better business decision making.
What are the five basic tasks of business intelligence?
The 5 basic tasks or can be called as Common functions of business intelligence technologies include reporting, online analytical processing, analytics, data mining, process mining, complex event processing, business performance management, benchmarking, text mining, predictive analytics, and prescriptive analytics.
What problem does business intelligence solve?
Business intelligence tools help to make sense of the enormous quantities of data business have regarding customers, suppliers, and business partners, and help uncover the insights within that data that are vital to winning in the marketplace. Business intelligence is an umbrella term for various methods of collecting and analyzing this data to help organizations make data-driven decisions.
How BI, Data Analytics, and Business Analytics work together?
Business intelligence includes data analytics and business analytics, but uses them only as parts of the whole process. BI helps users draw conclusions from data analysis. Data scientists dig into the specifics of data, using advanced statistics and predictive analytics to discover patterns and forecast future patterns. Data analytics asks “Why did this happen and what can happen next?” Business intelligence takes those models and algorithms and breaks the results down into actionable language.
What companies use business intelligence?
Almost all Companies right from Enterprise to MSME use Business Intelligence – Amazon, Google, Microsoft, Genpact, VMWare, Target, AliExpress to name a few.
Is business intelligence a good career?
Business Intelligence is one of the top career choices in IT industry right now, with high remuneration packages, onsite opportunities, job satisfaction and easy to adapt technologies.
Business Intelligence vs Data Science
Both business intelligence and more recent technologies like data science are predicated on gaining business insight based on data analysis. The primary function of BI tools is to explore past trends in a business’s historical data and compare data across time. Data science tools, on the other hand, use algorithms to understand and predict a business’s future performance. Data scientists build data models to try to answer questions or discover predictive patterns in huge volumes of data.
Business Intelligence vs Business Analytics
business intelligence helps in the day-to-day operations and how things look in the present, whereas business analytics helps business planning for the future, such as using predictive analytics to figure out why things are happening and how things will look in the future. Individuals that handle business analytics, typically have a background in mathematics or statistics or an online masters degree in business analytics. Business intelligence experts should also be good with numbers and have an analytical mind.
“BI is looking in the rearview mirror and using historical data. Business Analytics is looking in front of you to see what is going to happen.” – Mark van Rijmenam, CEO / Founder at BigData-Startups

Business Intelligence vs Competitive Intelligence?
Competitive intelligence is defined as the process of gathering and analysing intelligence about a business’s external environment, such as the market landscape for a particular industry or a business’s competitors. In contrast, business intelligence is understood as internal business insights, what your company is doing.
Business Intelligence and Competitive Intelligence may technically have different definitions, however they are closely related and must work together to make informed business objectives. Some consider competitive to be a subset of business intelligence because the information gathered from competitive intelligence adds value to data collected from BI and decision making.

Conclusion
This article is just an introduction to the world of business intelligence. BI offers capabilities for near real-time sales tracking, allows users to discover insights into customer behavior, forecast profits, and more. Diverse industries like retail, insurance, and oil have adopted BI and more are joining each year. BI platforms adapt to new technology and the innovation of its users. Stay up-to-date with all of the trends and changes in business intelligence by following this Blog for more such information !
Like!! Really appreciate you sharing this blog post.Really thank you! Keep writing.